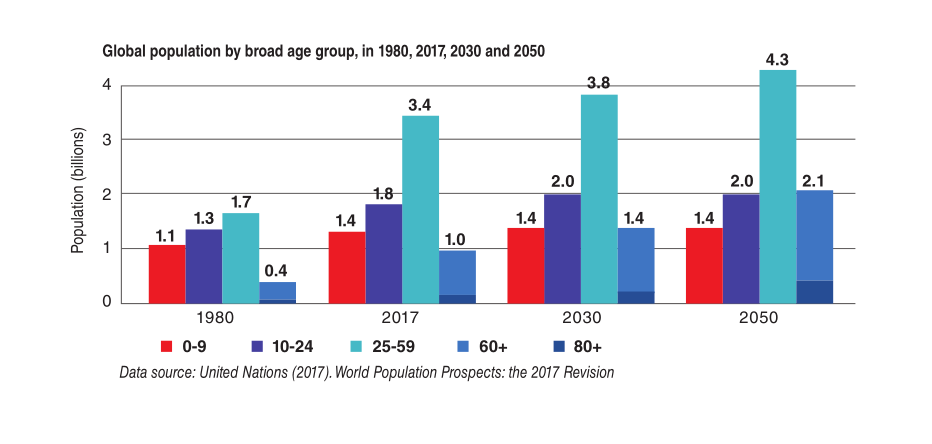
Our Population in China is having the greatest number for a long time. 2019, China’s population is over 1.4 billion and with 0.39% rate of increase. the well-known birth control in the country is started in 70’s and rapidly lowered the fertility rate and the increase of population, but the crisis which will come after the overwhelming excess of population, the “Aging of China”. the prospects given by OPCS(Office of Population Census Surveys) shows that, if the country growing as still, the aging of China will be a problem lying in the front.
I’m a student from the course of system thinking, yet we decided to have a research under the iceberg under the data, and figure out why the population growth like these.
China total population over time(1978 to 2014)
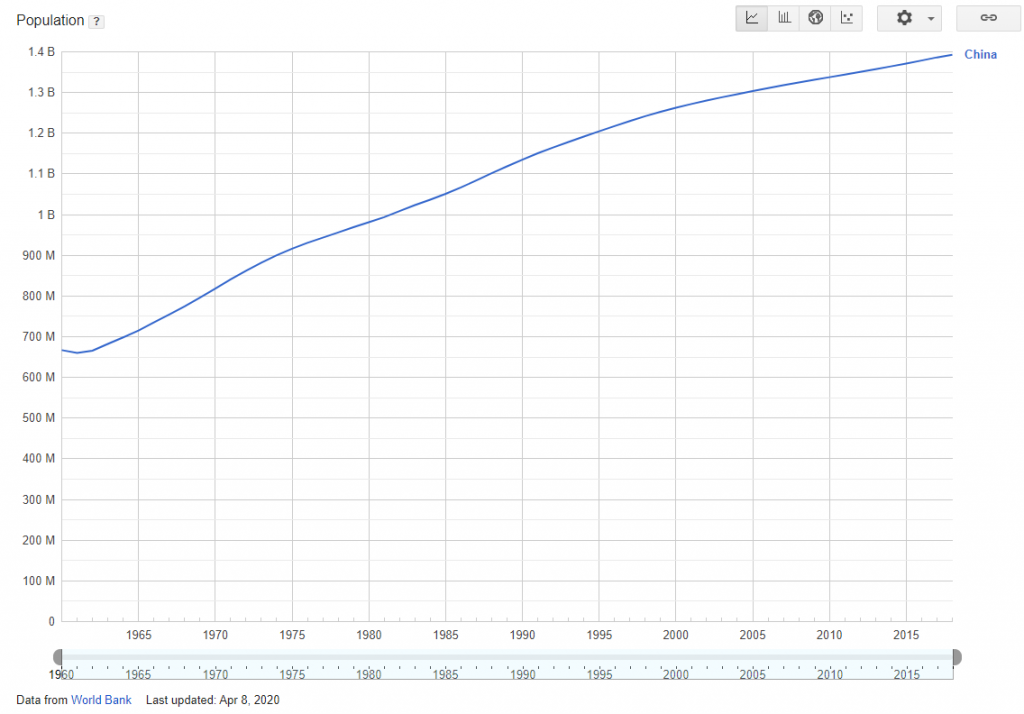
Resources: World Bank
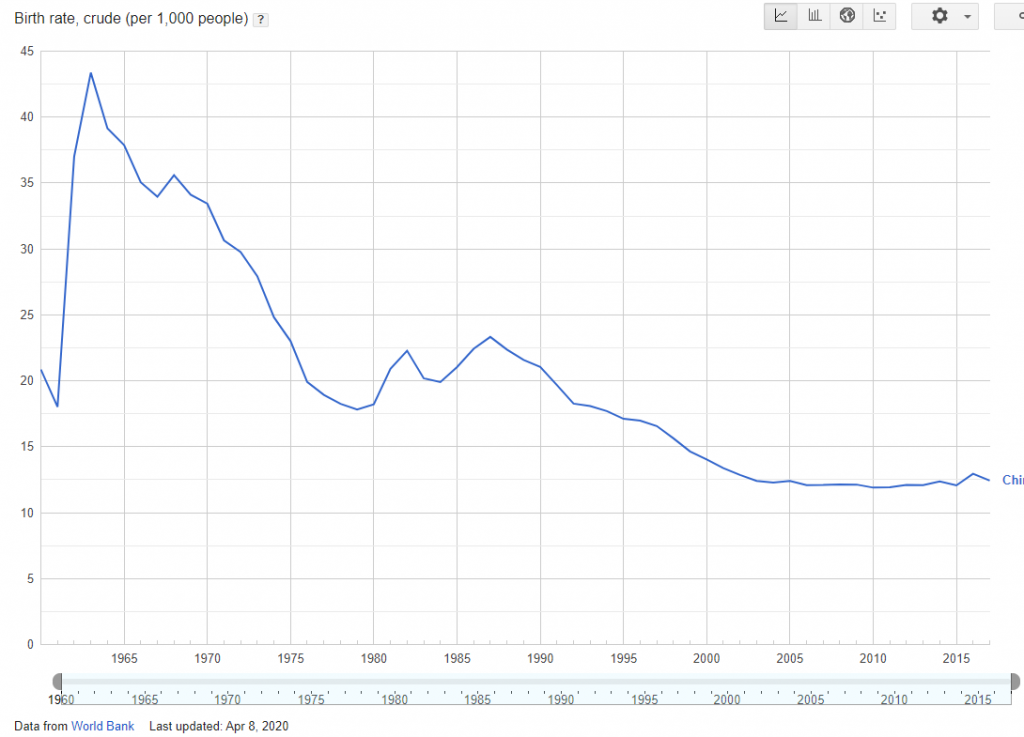
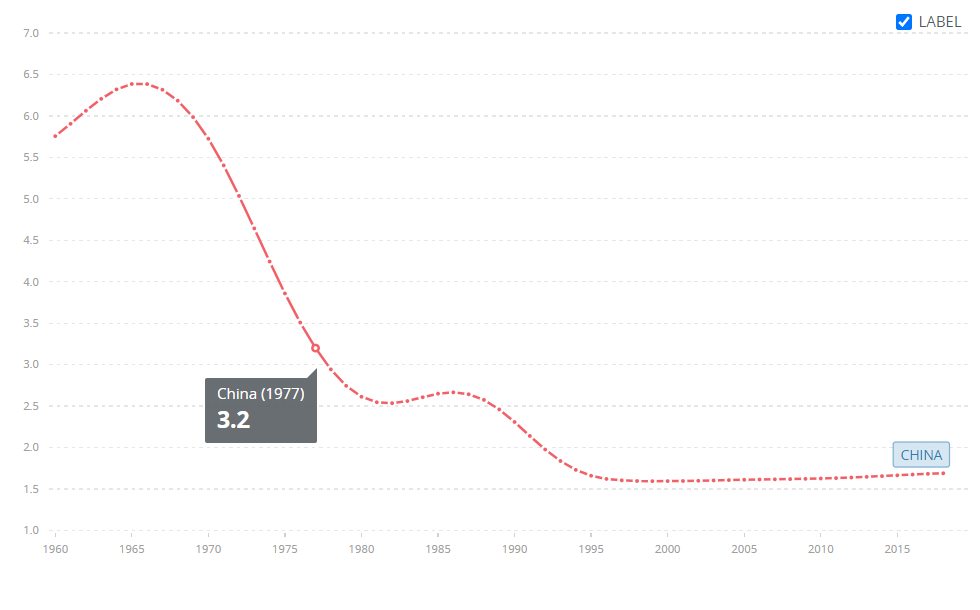
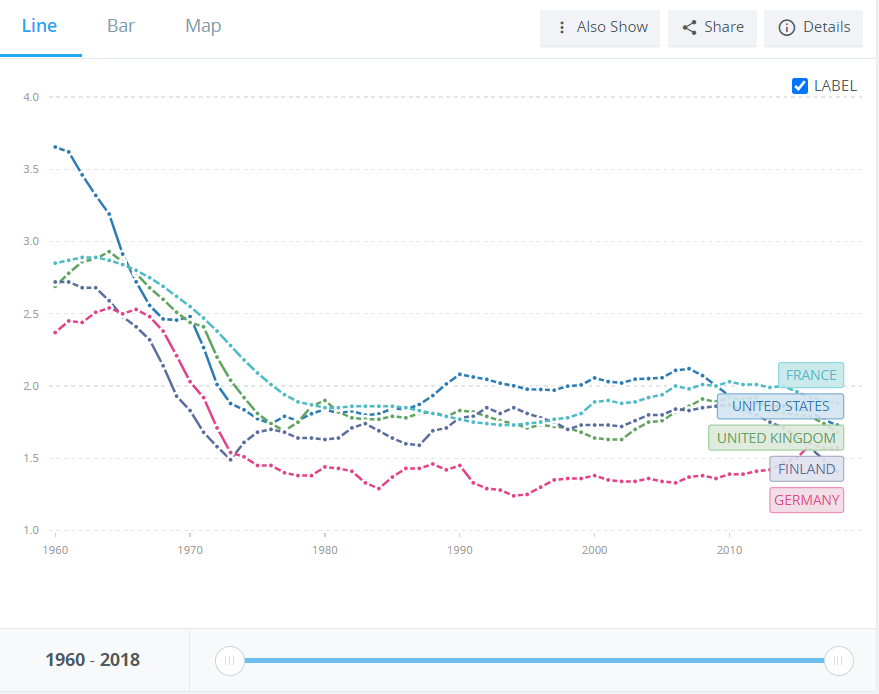
we can see that the graph demonstrated the fertility rate shows that the climax of population in time is around 1965, having the rate of 6.385, and after that, the fertility rate went down to 2.5 during 1965 to 1995, a pick up of population is about 1980, and continue to fall to 1995, and shows a rate of rising gradually till present days.
Birth Control Policy (family Planning/One Child Policy)
By researching that the story behind the decreasing came after the climax is the birth control policy appeared in China. Yanchu Ma proposed a article about arguing the population in the country and the idea of birth control in 1957. 1962, a serious protocol of the Central Committee and the State Council. Until the 1964, which year the Family Planning Committee was formed, and the policy started to operate at the very first time. At that time, 1/5 of village down the country side were forced to running the new policy. And that is exactly the reason that we see the decreasing of fertility rate.
After the policy was built, the strength of the control became more and more harsh. In 1973, Family Planning was already counted as a national policy, and claimed that a pair can only have two child, having one child is the best. In 1980, the control of policy’s requirement down to one child per pair, which is as known as the One Child Policy.
This explained that the fertility rate’s decreasing in the graph: it once stopped at 1980, around 2.5 birth rate, which is close to the limits of 2 child policy, and after that, 1 child policy published, population was declined again, almost reached the 1.5 line.

After the prominent work of the one child policy, government started to notice that if the country’s fertility rate keeping going down, the decreasing of new child will not be given the birth, and the country will face another huge problem, the aging of the country. the percentile of 65+ population will take more portion in the population, they need retirement, require for caring. The working power with no new blood boost in, the entire country will enter a old age.
So, One Child Policy is not a long term project, once the fertility got controlled, government need to open the policy for family planning. around 2010, 1.2 Child policy published, and then 1.5(1.5 means if one of the pairs is from a one child family, the family can have 2 children)
Finally, in January, 1 2016, the universal two-child policy published, and ended the two score and 1 decade birth control period, but the controversial policy in the China is no longer is still exist, people are still waiting for maybe the “three-child policy” or no policy for birth control.
Today is April in 2020, as the previous mentioned, the prediction of 2055 in China, the population is still a big problem. Even though for now the increasing rate seems fine, China still have 0.39% population growing. But in the perspective from the long term trending, the increasing will no longer be it. If China, a colossus with 1.4 billion population, started to losing the fertility rate really quickly, then the aged group in the population will stand in a very dangerous position in the way.
Let’s say that if we can analyze the country and government a system, figure out the principle behind it, then we shall predict what will happen in the future
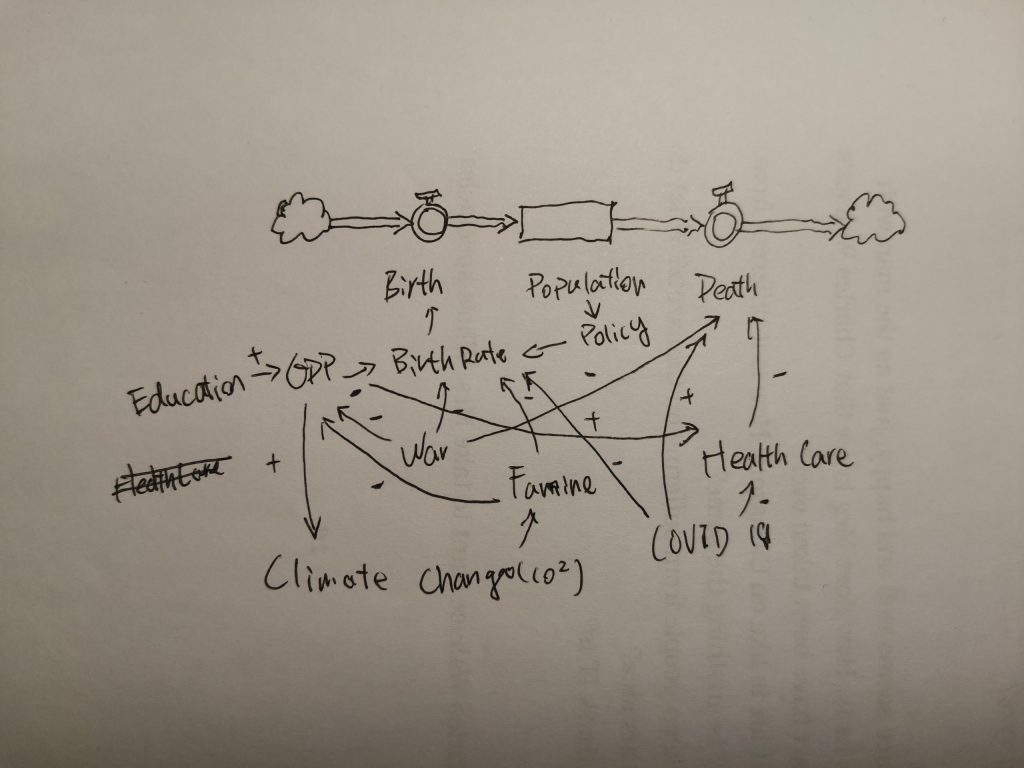
CLD (Casual Loop Diagram)
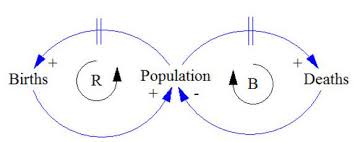
Balancing feedback loop is a condition of feedback loop when the “direction” of the interaction between different elements are opposite.
When one of the elements in a balancing feedback loop changes, for a response, the other element will change more. However, this increase of change will cause a decrease of change on the initial element.
At a word, when element A in a reinforcing feedback loop increases/decreases, the other element B will also increase/decrease. However, this change will make A decrease/increase. The system finds its balance in the fluctuation listed above. —- DIY Definition by system thinking students
The balancing loop is the tools using to modeling the appearance during 1965 to 2016. as the definition of balancing loop, an element in a system, will be balanced by a mechanics in the loop. if the element get over the predicting value, or lower than, the balancing loop will try to balance the value to the most suitable one.
so every time the population increased or decreased, the birth control(by the government) will balance the increase or decrease to normal. For instance, in 1965, overwhelmed population and the striking number of 6.3 of birth rate made the Chinese government realized that the population will destroy the country if it keep increasing without intervene, then the family planning kicked in, balanced the population quickly.
Delay
But in the title of analyzing the population in a country, China spent 15 years to restrain the increasing population(from 1964 to 1980), this is a delay in the system. Delay in population control is nonnegligible. the policy will not remove thousand of population instantly, but for decades. A full-fledged policy need time left to test it. For birth controlling, 5 decades over, the aging of population still exist, this is the hardest part for a long-delayed balancing loop, government need years to re-amend the policy.

After those analyzes, we figure out how the government control the population. the system of balancing loop will keep adjust the input over time, until the population goes fine. And the delay in the system, is the biggest problem that makes the balancing tough to handle. Although the prediction made the aging of China, the balancing shall prevent it before happen.
Consider with more comprehensive analyze
But the elements we have include or considered is enough, for analyze the population, there are many factors that can influence the population. War, famine, policy, even being wealthy can impact on the population.
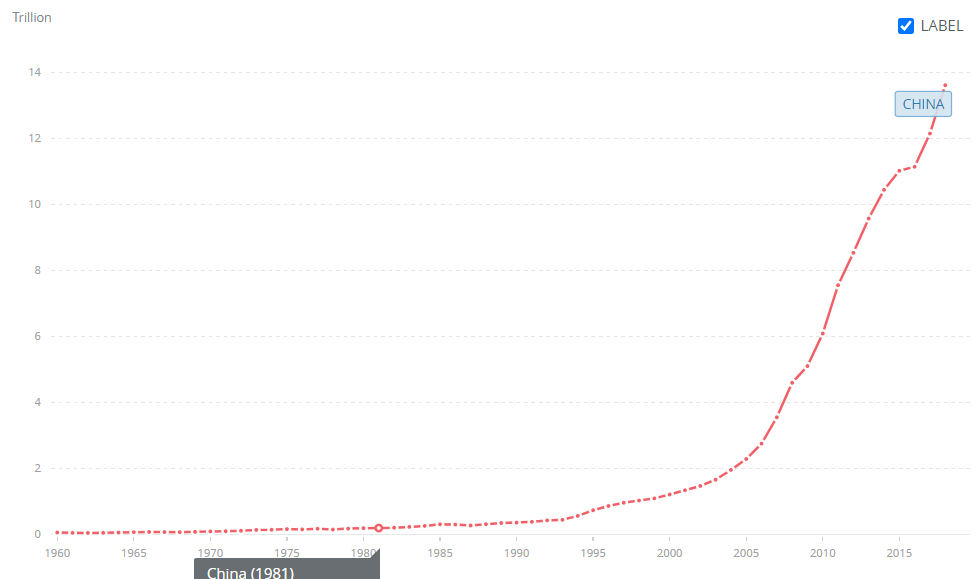
From observe the trending on the graphs, we can see the GDP of China is upgoing quickly since 2000, and in the contrast, the fertility rate is falling quick falling since 1960. In math, we can call two data group “negative correlation”. Which means, the growth of GDP will cause a edgrowth of fertility rate.
If we only consider the data from 1960 to 2018, the correlation can be defined as negative. However, the relationships between population and other factor can not be listed detailed right here, but the more factor you have, the more of your diagram’s accuracy will contained
I think there is no way that somebody can run every elements that influence the population, nobody can. So to be much detailed is not the way out. Otherwise, people can tell the future.
Bring the big picture view of problem
To analyze the population, I pretty much sure that you’re not gonna success with list every possibility. Thus, why don’t we zoom out, and use a more universal tools?
Archetypes is the phenomenon that people observed and summarized from common systems. We can use the archetypes that apply to our system and use the common solution to describe it.
After viewed the archetypes, I decide to use “The Limits of Success/Growth” to describe the phenomenon of the population in a country.
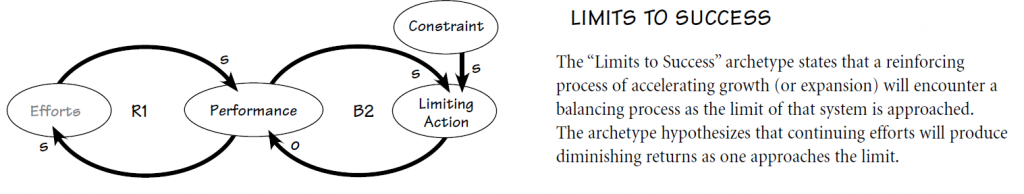
Sample Limits to Success Behavior Over Time
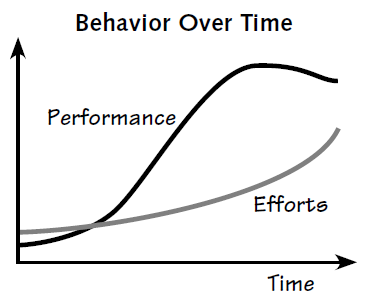
The reason why I decide to use this diagram, is that from my observe of population, countries tend to approach to the a steady ratio of fertility rate at last. To understand the phenomenon of limits to the growth, we can look in to the example of it.
The example in the limits to the success is that a company that seal the fish started to collecting wealth in the beginning, they catch fishes from the ocean, and use the money of sealing the fish to expand their shipments. The scale of the company growth and growth until they reached the limits of success, they can’t get more fish from the ocean, because the total amount of fish can not satisfy them.
This can be apply to the country population as well. The total amount of resources on the mainland is limited, that could only support such amount of population to live. As long as the population reach the limit, the number will not increase anymore.
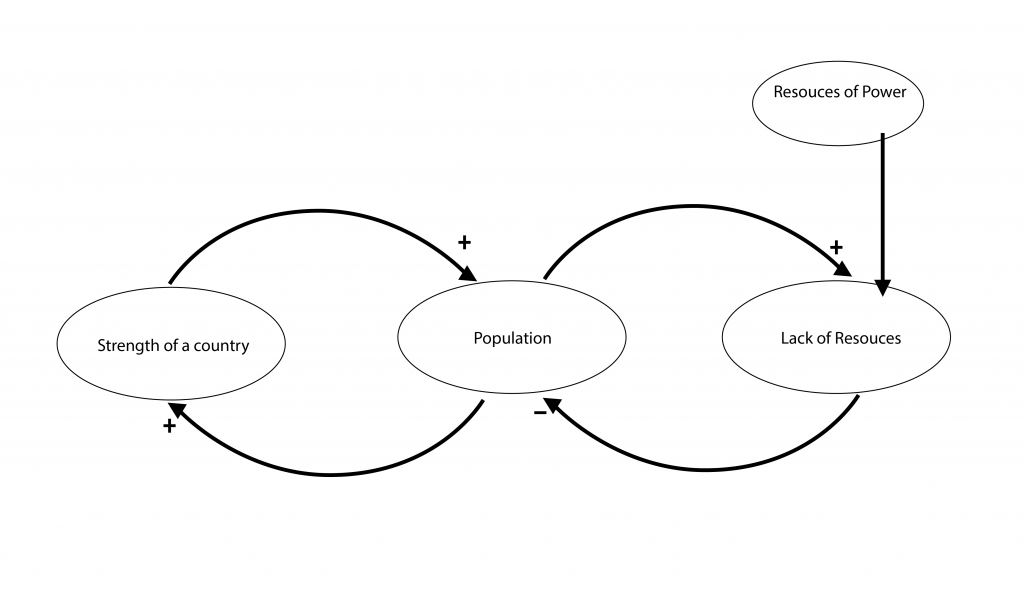
I apply the idea to the CLD sample of the archetype, then I have this:
The total amount of resources will supply the population in a country. In fact, the total resources is limited, so the population will finally started to be balance by the lack of resource.
There is an exception right here, that is the conversion rate of resources, or the utility ratio of power. People can only use their body effort to farm the land to get cereals. But as long as the invention of machines, locomotive steam machines, and the electricity. We can use less effort to generate more power. Revolution can bring population boom in a short period.
Back to the China: What can China government do?
The Leverage Action is the point that you can put the less effort in a system to exchange for the maximal change to the system. Just like an leverage. If we’re able to find the most efficient leverage point in the population system, then we simply solve the problem.
So the leverage action that the archetype of The limits of growth gave us the point below:
“This archetype is best addressed by mapping out the interactions of the growth loops, resource stocks, and potential limiters to growth in the future before problems arise. In the case of overfishing, this may include slowing down growth in the short term in order for fishing stocks to recover. Or in the case of an economy’s dependence on oil, the solution may be to to decouple the limiting factor from the system itself by transitioning to alternative energy sources.”
(source from:https://systemsandus.com/archetypes/limits-to-growth/)
The Two way that archetypes lead the solution, is to stop the overusing the resource in the system, to let it to recover. If China is going to take the strategy, they should limit people from overmining the ores, fishing the fishes. This is the policy of all the developed country are doing. Slow down the exploit and prepare for the long term. I’m pretty sure the China government must planning on this.

And second strategy is to jump out of the factor that limit the system, or in the other way: do something revolutionary. We can discover a new field of resource to use, then the loop of limitation won’t limit us. New type of energy is still hot topic in scientific research. Clear energy, which can produce zero emissions, is the only way out to save a country