artifact
artifact title
Statistics Project: What is Right for me?
artifact label
STEM Artifact (SA)
introduction
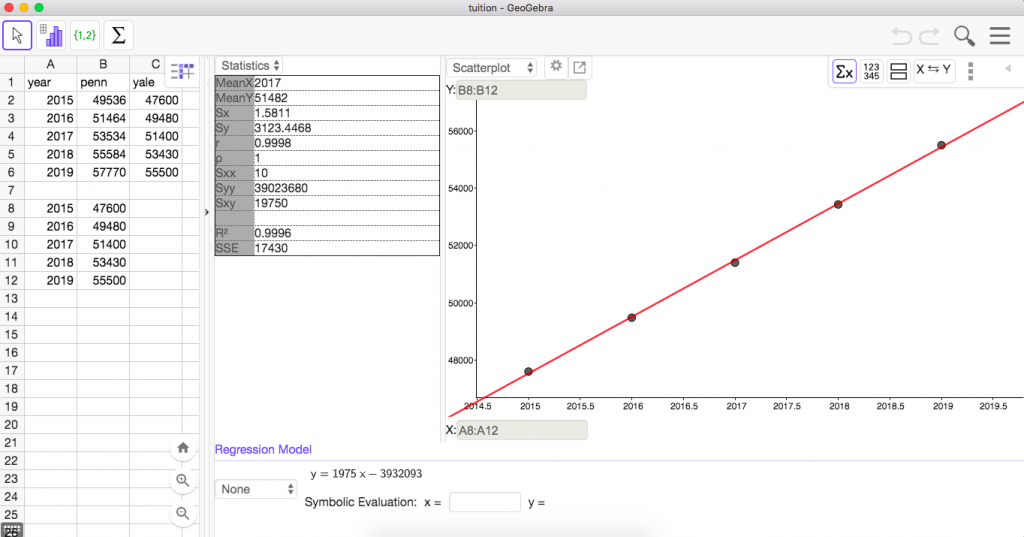
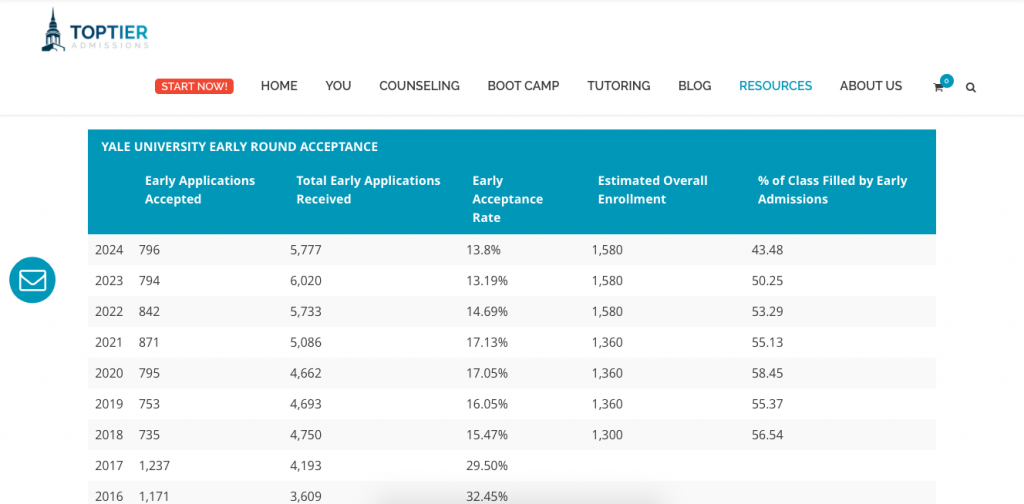
“What is Right for Me?” is a project about choosing a right university for myself through statistical method. Students need to choose two dream schools and come to a conclusion of which is a better school for him or her after comparing the data. Based on our learning of statistics in mathematics class , this project is dedicated to apply the knowledge in real life research and the result — the “right” university for me, can actually be a valuable reference when applying college. In fact, by creating graphs of tuition and acceptance rate of the past five years can predict the tuition and acceptance rate of the year that I will be applying; by comparing location information such as income and crime rates, can give a rational and logical reason to choosing a suitable school rather than “I feel like it”.
The project is divided into four sections: tuition and fees analysis, acceptance rate analysis, location analysis and report on option. The whole project is about data collection and organization and compariso, so the report is filled with numbers rather than an essay discussing the process of chossing the “right” university. The knowledge of mean, median, range, correlation coefficient and standard deviation is applied to tuition and fees and acceptance rate analysis. For location analysis that includes population distribution, income and career, crime rates and educational attainment, I couldn’t find raw data, so I included data that is already calculated by organizations. The report on options is a comparison between the two universities and finally concludes the student’s choice.
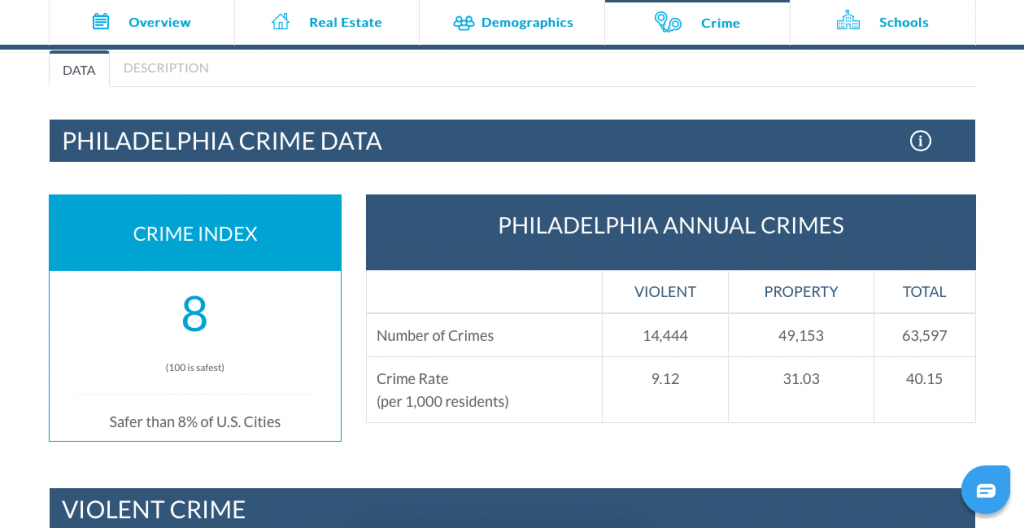
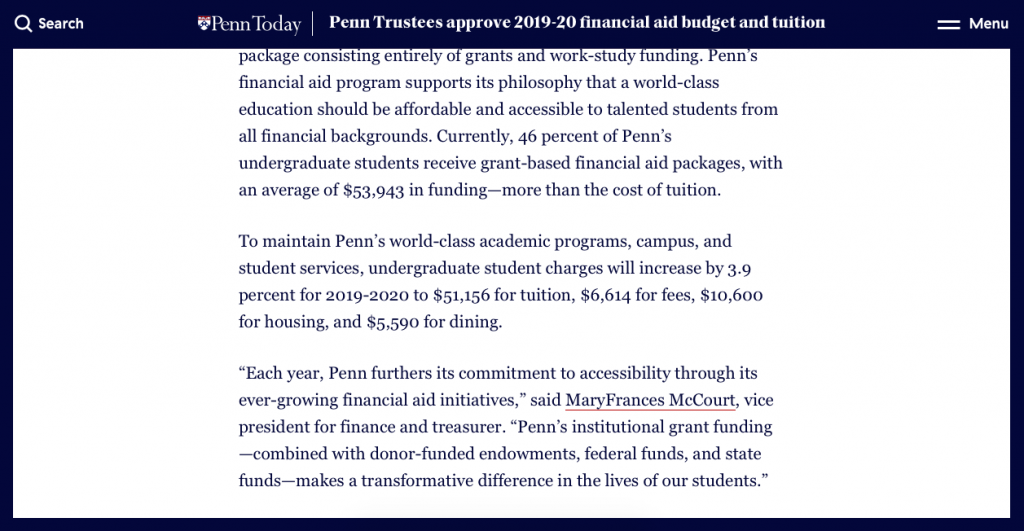
I choose Yale University and University of Pennsylvania. Yale has always been my dream school ever since I watched “High School Musical”. There is not a specific reason, my impresion of Yale is always good. I also chose University of Pennsylvania because I liked the presentation given by a UPenn admission officer in a college workshop. My conclusion is that UPenn is more suitable for me because it has higher acceptance rate, and Philadelphia has lower crime rates and higher income than New Havens. During the process of researching, I got various numbers from different websites and finally decided to used the university official websites and a website named Neighborhood Scout.
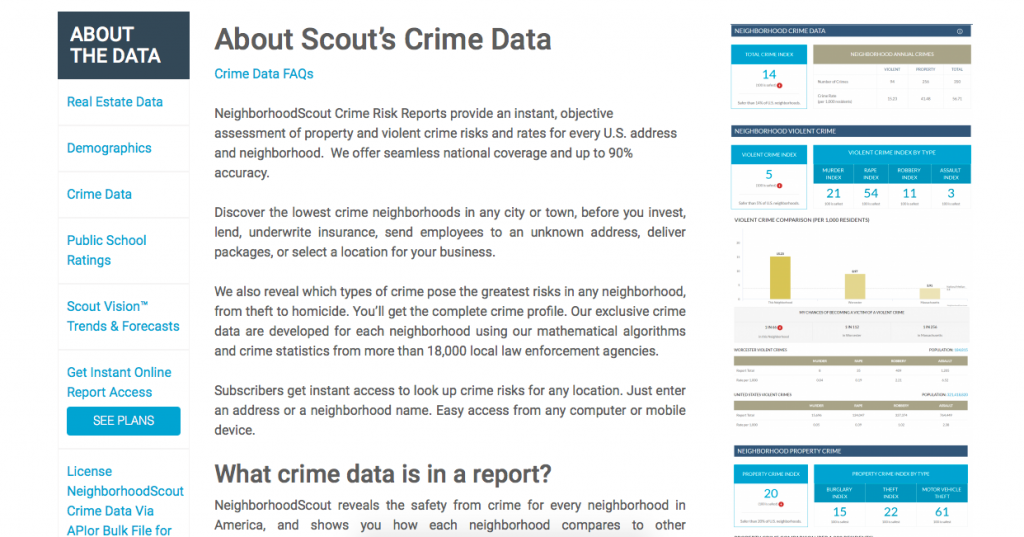
Neighborhood Scouts is a website mainly focused on custom analytics to invest, appraise, or finance real estate. The website provides location information of any place in the US, and is in collaboration with organizations like U.S. Department of Homeland Security. They also provided very detailed explanation about their raw data source. Therefore, I think this is a very credible source that is authoratative, relevant and timely for me to use. The bibliography in the report is cited in MLA style.
Through the whole process, my math teacher Sibyl offers help at anytime and is willing to answer any questions that we have. By the end, the project is completed nicely and I feel a sense of accomplishment.
self-reflection
This project is an oppurnity to pre-experience how to choose a “right” university for myself through a very logical and data-based method, and in the future I can apply this process of analyzation when I am actually applying for university. It is also a practice for me to apply the knowledge that we learned in math class and test my understanding. While making this project, I also gained new knowledge: a location can be measured in so many aspects. For example under income, there is per capita income, median household income and individuals below poverty level. I learned how to use Geogebra wisely, for example how to apply a line of best fit and check its equation, and how to check the data set’s correlation coefficient without calculating by myself.
The competencies involved in this project are Information Literacy and Critical Thinking, and I think I have reached the proficient level for both competencies.
For Information Literacy:
I believe I have achieved all skill strands in Information Literacy, and I would like to specifically talk about 1B , 1D and 1E.
- 1B is about researching effectively, and my strategy is to search for key words like ” yale tuition 2019″ or “New Havens crime rates 2019”. I think including time is very important because these numbers change every year, so in order to get the exact information I will search for the year. I also will check different websites and consider which one is more credible, so that my report is also reliable.
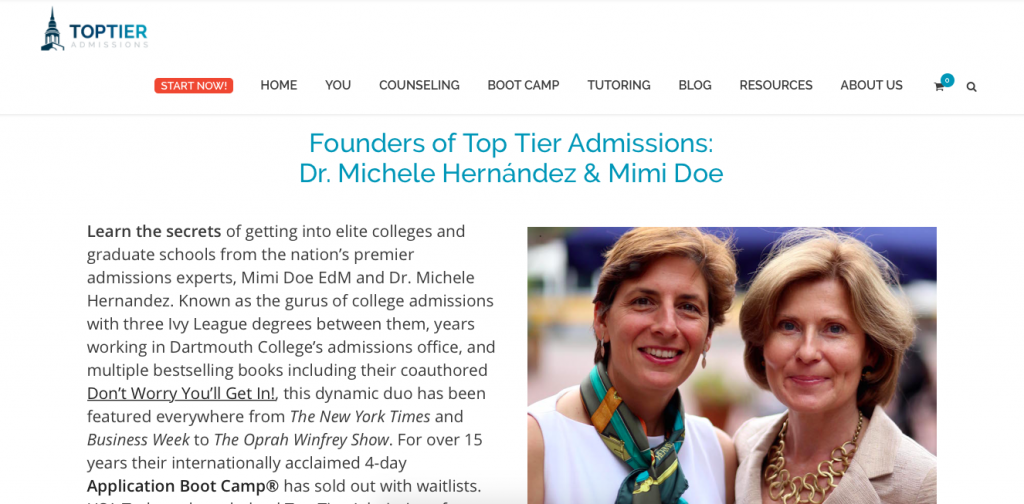
- 1D is about evaluating information and sources critically. I compared the research results from Quora, Yahoo Answers, university official websites, random organizations, and finally sticking to the credible sources like university official websites and a organization named “Neighborhood Scout”. Another credible website that I found is “Toptier Admissions”, which is a professional college counseling organization. And by drawing conclusions from the data, the new knowledge of “UPenn is actually more suitable for me” took over what I used to think “Yale is the best”. The researched data can satisfy the original need, but when I need additional information such as the correlation coefficient of the tuition in the last five years I will to create a graph and check by myself.
- 1E is about using information effectively to accomplish a specific purpose, and in this case my purpose is to find a “right” school for myself. By communicating in forms of data and organizing tables and graphs, I reached the purpose: UPenn is a suitable school for me because of its higher acceptance rate, lower crime rates and higher income.
For Critical Thinking:
I believe I have achieved almost all skill strands in Critical Thinking, and I would like to specifically talk about 5B and 5C.
- 5B is about organizing information and evaluating its credibility. In my report, I identified characteristics of different types and patterns of data such differentiating measures of crime an identifying a strong positive correlation of the tuition; and evaluates the different sources’ accuracy and relevance by believing in the authority of university official websites and checking Neighborhood Scout’s statistics source as mentioned many times above.
- 5C is about reasoning, and I gave a reasonable report with statistics evidence support. In my conclusion about which school should I choose, I compared many aspects from the report and also gave opposing point of view about Yale’s advantages.
If I can still improve, I think I will try to come up with a solution that is more specific, sufficient and well analyzed, because my conclusion at this point didn’t compare all the data that’s collected in the report. Therefore, the conclusion is less accurate.