- What does the orinigal data frame look like? Give the data frame and name the subjects , variables, type of each variable in the data frame.

subject: 1-5月用电情况(空调、照明及动力)
variables:月份(分类变量)
空调(定量变量)
照明及动力(定量变量)
2. What information can you get from each graph.
- Point out at least 3 pieces of information in each graph
图左:上半月用空调量较少,下半月用空调量较多;照明及动力比较平均;5月21号用空调量比其他都高。
图右:1月用空调量较高;照明及动力比较平均;4月用空调量很少。


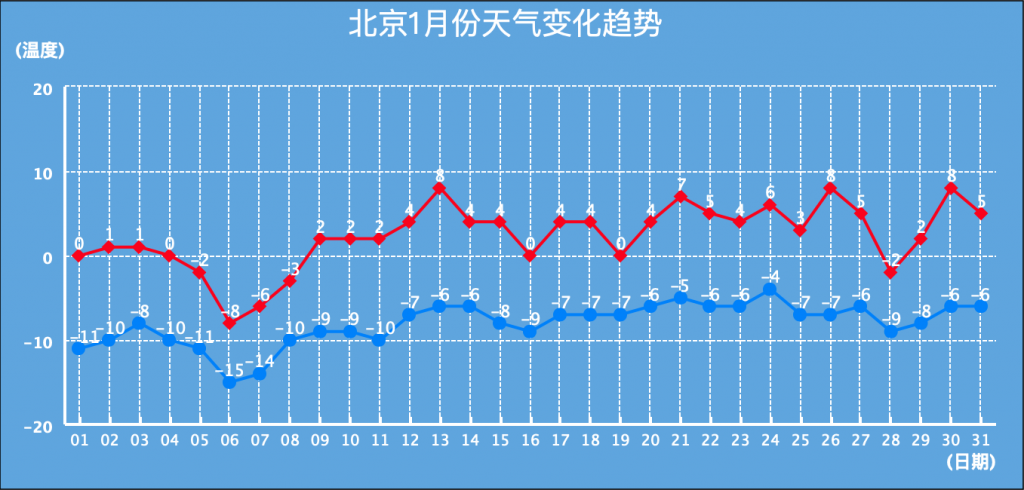
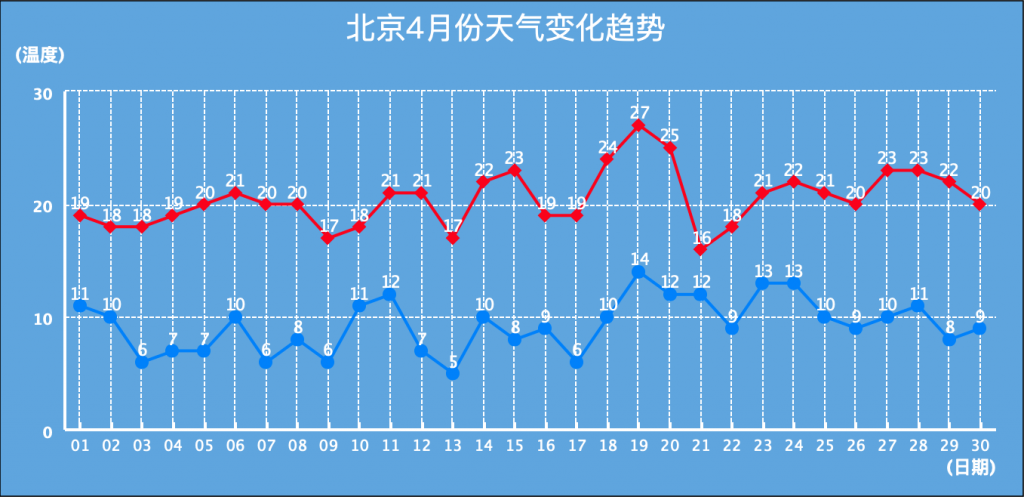
(2) Try to use your reasonable induction to explain what situation leads to the information you give in (1)
图左:5月中旬学校通知开空调,所以从16号之后大部分寝室开始用空调;学校熄灯制度一直没变;5月21号健身房修空调漏水了。
图右:一月份温度很冷;校区内除二月份放假之外其他;4月天气适宜,不需要开空调。
3. Please compute how much MSA would pay for the electricity consumption in Jan-May ( You may need some research on internet and build your computation model)
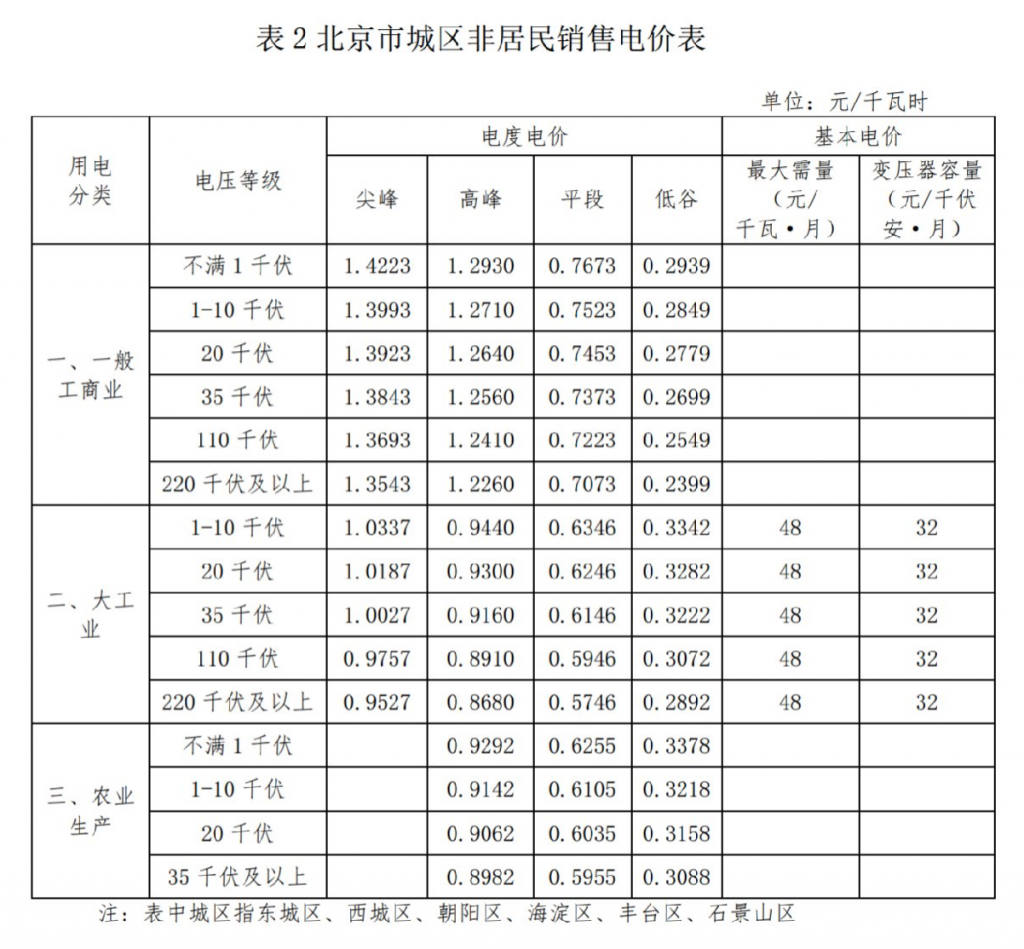
(下图来源于百度)

一般工商业不满千伏以上平均电价: (1.4223+1.2930+0.7673+0.2939)/4≈0.9441
Jan: (840+300)KWh*0.9441yuan*31days=33364.494yuan
Feb: (50+130)KWh*0.9441yuan*28days=4758.264yuan
Mar: (410+250)*0.9441*31=19316.286yuan
Apr: (10+200)*0.9441*30=5947.830yuan
May: (80+200)*0.9441*31=8194.788yuan
Jan-May altogether=71581.662yuan
4. Please estimate how much MSA would pay for a whole year? Give your answer and the reason. (Tips: The information in both of the graphs should be taken into consideration)
Jan:空调和照明都多;Feb:空调和照明都少;Mar:空调照明都中等;Apr:空调少照明较多;May:空调较少照明较多。
Jun:气温很热,和一月份的用电量可能差不多。
Jul&Aug:学校放假,和二月份用电量差不多。
Sep:气温很热,和六月份的差不多。
Oct:天气适宜,和四月份差不多。
Nov:天气较冷,和三月份差不多。
Dec:天气很冷,但有地暖,和五月份差不多。
Jun-Dec altogether: 71581.662yuan+4758.264yuan=76339.926yuan
71581.662yuan+76339.926yuan=147921.588yuan
5. Are we power-efficient? Give your answer and your reason (Any reasonable induction based on the situation in MSA or any comparison with other organizations may be acceptable)
我们没有很节能。
在学院的角度,温度比较极端的几个月我们的用电量都非常高。并且很多学习者为了晚上熄灯后自习在白天给台灯充电,导致很多插头没有拔下来,耗电还危险。
在个人的角度,我认为我们并没有很好的控制电的消耗。比如我们宿舍有时候会忘记关空调,白天灯可能也没有关。