SA
#Learning how to learn
Also→ https://www.bilibili.com/video/BV1A7411Z7ef/
Introduction
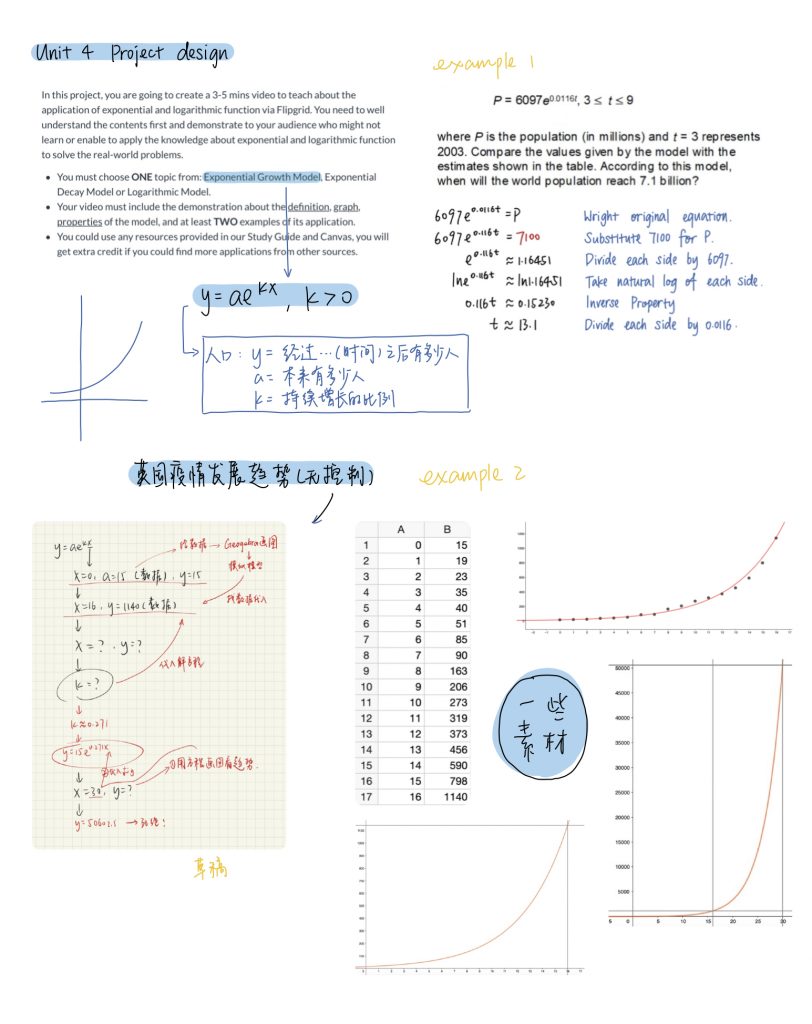
This video is our first Math-2A milestone of the semester. In the first month, I learned the practical application of exponential function and logarithmic function, so I chose exponential growth model and COVID-19 as my milestone theme.
The COVID-19 outbreak was very serious in February, and there was a lot of popularisation of science and research on the Internet. I became interested in the infection model of infectious diseases after watching a lot of videos and articles. The knowledge of exponential function I learned in math class was exactly related to the increase of infectious diseases, so I focused on searching for information about infectious diseases model. Due to the simplification of the model, the topic I explored changed from “actual trends of COVID-19 infection” to “trends of COVID-19 infection that will occur if the government does nothing”. On the other hand, the UK was in the midst of a surge in the number of infected people, and the government had not taken any strong measures to require people to isolate at home or maintain social distance, so the data on the number of infected people in the UK was a good fit for my study. Then, after working with Sibyl to identify the model and data, I mapped and analysed it with Geogebra and concluded that if the UK government did nothing, there would be more than 50,000 COVID-19 infections in the UK in 30 days.
In the end, I made a video with Procreate and posted it on Bilibili.

Self-reflection
This project not only enabled me to re-examine my understanding of the exponential growth model and to use Sibyl’s data to fill in gaps where the concept was not clear, but also enabled me to understand COVID-19 from a more professional perspective. The biggest challenge I encountered in this project was that I couldn’t understand the SEIR model of infectious diseases by reading articles on the Internet without having learned calculus. So I found some relatively easy videos on Bilibili, watched them myself, and went to see my mother, who is a doctor, and spent an afternoon figuring out what the model meant (though I still couldn’t do calculations with it).
At the same time, in terms of mathematics, I reviewed the Desmos exercise I did in the previous class and tried to use the data to draw pictures on Geogebra, but it was always wrong. Later, after my own inspection and discussion with Sibyl, I found that the X-axis and Y-axis of my two graphs were not consistent, so I could not make a comparison. Through these, I improve my ability on Learning how to learn.
One of the things that can be improved about this video is that I’m assuming that anyone watching this video knows the relationship between COVID-19 and the exponential growth model, but a lot of people like me don’t know what the epidemic model looks like. So I’ll give some background knowledge if I update the video.